About This Project
A few months back, I read a really excellent (but pretty old) blog post that explained how to hack a toy called a Mind Flex to extract and analyze the data within it. At first, I couldn't believe that such a thing existed. I mean, sure - gimmicky toys have been around for ages, so I wasn't shocked that the toy claimed to read the user's mind. It's not uncommon to fake this kind of gimmick. But, the fact that the Mind Flex contains a real, legit EEG chip that read your mind seemed almost too good to be true. I wondered if it was possible to take this hack a step further. Instead of just reading the data, or using the data to "control" something else, what if I were to read the data while performing some task and see what the data reveals about my performance during that task? I would need to complete an activity with quantifiable data to properly compare the brain activity to the task results to see if my attention levels correlated to the task's success or failure. Deciding on the actual action to measure wasn't tricky. I am a pretty avid video game player and had recently been trying to think of a way to integrate my gameplay statistics into a project, so I surmised that the combination would be an intriguing one.
Want To Learn More? Would you like me to present this project as a session at your conference or event? Maybe you just want to reach out to learn more about the project? Feel free to send me a message via my blog contact page or on Twitter!
So I asked myself: "if I could hack the Mind Flex and wear it while playing Call of Duty, what would the data show?" Could I establish a relationship between cognitive function and video game performance? In other words, when I'm focused and attentive, do I play better? Or, when I'm distracted, do I play worse? Is there no connection at all? I wasn't sure if my tests would succeed, but I decided to find out.
- Video Overview
- Asking Questions
- Objectives
- The Hypothesis
- The Architecture
- Uploading My Brain to the Cloud
- Building the Micronaut Application
- Collecting the Data
- Analyzing the Data
- Interpreting the Results
- Distractions
- Results and Summary
- Links
Video Overview
If you'd like a more entertaining, but slightly less technical overview of this project, check out the following videos:
Asking Questions
Once I established the idea for the project, I started asking myself some questions:
- Can I read my brain data?
- If so, is the data valid?
- Can I improve my performance in video games by being super focused and concentrating?
- If I'm distracted, will I play poorly?
- Will a "bad game" be visible in my brain activity?
- Is there a direct, measurable relationship between superior gaming performance and high levels of attention?
- Or, are there just too many factors at play?
Objectives
To answer those questions, I decided to establish a few objectives for the project:
- Capture my brain data (at home) in an accurate and cost-effective manner
- Establish a "baseline" mental state
- Capture my brain data while playing a video game
- Quantify my video game performance (via data)
- Establish and visualize a relationship between the cognitive measures and my game performance
Now I should mention that constraints and outside factors come into play. Things like server/network latency, "skill-based matchmaking," opponents' skill-level, and other unknowns. Could those external factors be excluded? The outside factors concerned me a bit, but I decided to move forward and let the data tell me a story.
The Hypothesis
Since I decided to take a "scientific" approach to this, I decided that it made sense to establish a hypothesis. The hypothesis that I came up with is as follows:
The more focused I am, the better I will perform at a multiplayer "first-person shooter" (Call of Duty: Vanguard). Conversely, my gameplay will be negatively impacted by a lack of focus and attention.
This hypothesis made sense to me at the time when I established it. I figured there would be a linear correlation between my attention levels and video game performance. Indeed, the more I pay attention, the better I will score, right? I assumed the data would ultimately look like this:
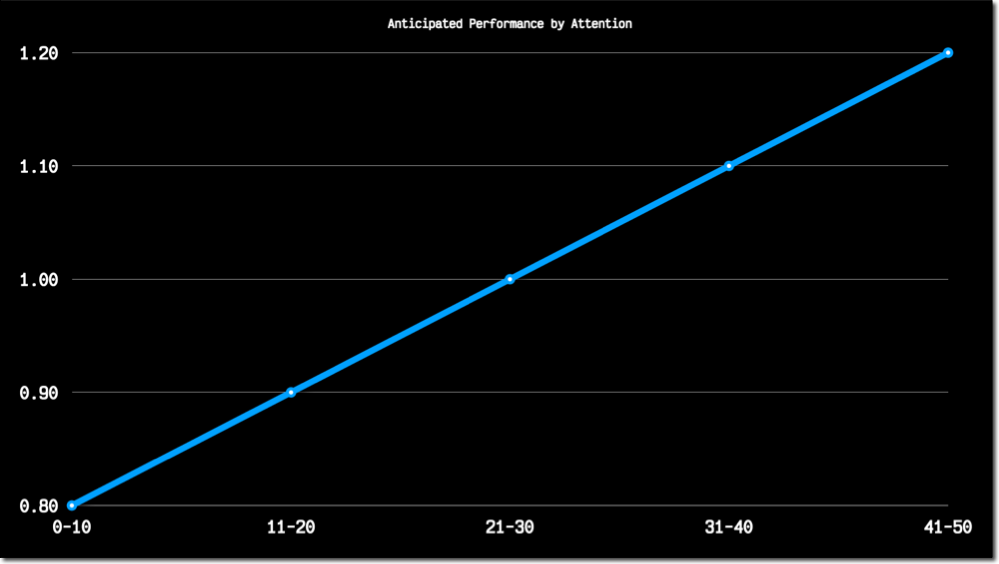
The Architecture
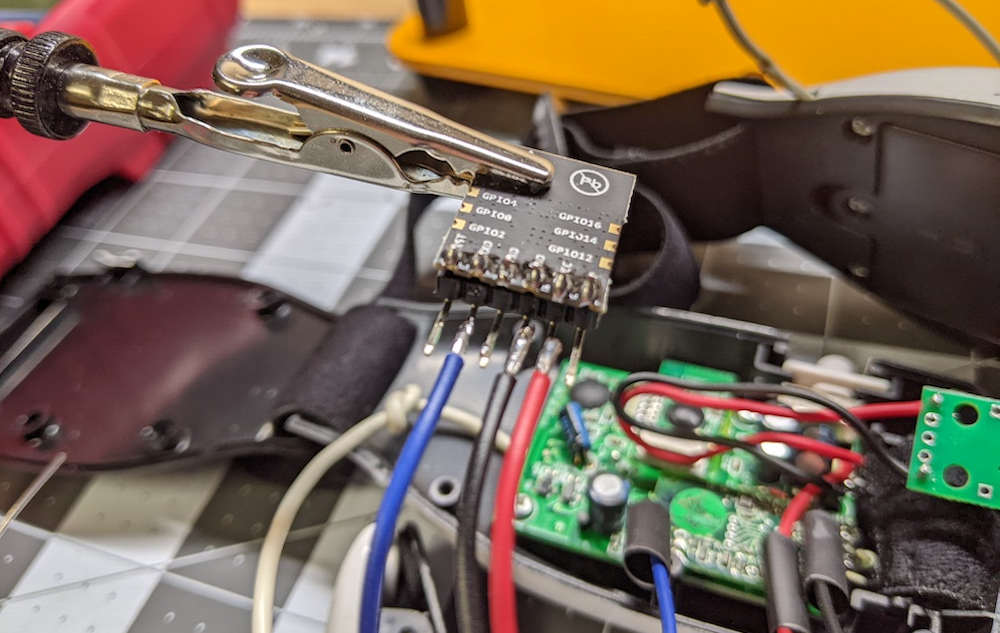
I would need to obtain and hack a Mind Flex to test my hypothesis. I decided to use a much smaller ESP-12 board instead of the Arduino board that the original blog post used because the ESP-12 board contains onboard WiFi, and I figured I'd be able to keep it self-contained inside the Mind Flex housing. So my approach was to use the Mind Flex to capture my brain activity by connecting the "transmit" pin on the EEG chip to the "receive" pin on the ESP board and program the board to upload the readings to an MQTT topic. Here's how the ESP board looked once I soldered it to the EEG chip.
Separately, I'd need to capture my videogame stats via scheduled calls to the "unofficial" Call of Duty API. I created a Micronaut application and deployed it to the cloud to do that, with a task that runs every hour to persist the data into my Autonomous DB instance.
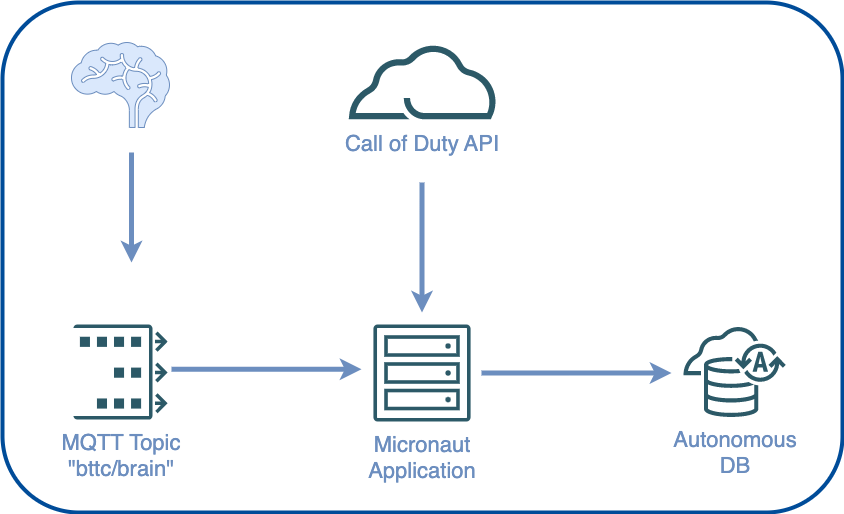
For maximum flexibility, I decided to store the video game stats in the raw JSON form, which would be easy to work with from SQL later on. Once the application had stored my videogame stats and brain activity in the database, I'd be able to write some queries to combine the data based on the match start/end timestamps joined to the brain capture timestamps—more on that in just a bit.
Uploading My Brain to the Cloud
Once I hacked the Mind Flex hardware, I needed to upload some code to the ESP board to capture the brain data and upload it to the cloud via an MQTT topic. The blog post that served as my initial inspiration provided the base code necessary to capture the Mind Flex data. I just needed to modify the code to connect to WiFi, serialize the data into a JSON object, and publish the data to the MQTT topic. You can view the entire sketch on GitHub, but let's quickly go over the important bits. First, we need to define an EspMQTTClient:
Next, in the loop() method, I updated the mqttClient, and check the Mind Flex for new brain data. If it exists, I serialize it into a JSON object and publish it to the MQTT topic via the mqttClient if it's been more than 5 seconds since I last published data.
That's essentially the extent of the Arduino sketch. The rest of the sketch involved connecting to WiFi and blinking LEDs, so there's not much else to it.
Building the Micronaut Application
For my cloud application, I chose the Micronaut Java framework. Micronaut is primarily a cloud-based, microservice framework. But it also includes support for rendering front-end views. My presentation tier isn't complex, so I decided to take a monolithic approach and include the presentation tier in the same application as the back-end API. I'll keep this post more high-level since I've already blogged about many of these features. Still, at the risk of being redundant, I'll mention a few of the highlights here and link to sources for further reading if you are interested in learning more about any of the specific features.
Persistence Tier and Automatic Autonomous Database Wallets
As you might imagine, the cloud application involved quite a bit of database activity. The obvious choice was Micronaut Data. It handles creating the database connection and even writes basic CRUD queries. Since I don't have to focus on boilerplate, I can instead focus on the business logic, advanced query logic, and presentation tier instead of writing boilerplate SQL for persistence and basic data retrieval. In a nutshell, Micronaut Data will configure a connection based on the configuration that you provide and implement your persistence repositories based on your mapped domain entities. To make life even easier, I reached for Project Lombok, which meant that I only needed to create domain classes with simple properties. I'd get full CRUD support at runtime, thanks to Micronaut's compile-time implementations. If that's not straightforward enough, I also relied on Micronaut Data's ability to automatically download my Autonomous DB wallet (used for TLS connections to my database) so that I didn't have to worry about downloading the wallet myself and storing it on the VM where I deployed the application. How about an example?
The first step is to include the required dependencies. I'll skip over that in this post because I would rather keep things high-level (refer to the docs). Once the dependencies are in place, I need to provide my configuration info in the application.yml config file.
To download my wallet, Micronaut needs the ocid and walletPassword. Once those are in place, Micronaut can use the Oracle Cloud Infrastructure (OCI) Java SDK to retrieve the wallet, store it safely in memory, and use it for my database connection. I also provided the credentials necessary to make a secure connection. You might be wondering why I've used the ${VAR} syntax in my configuration files, and if so, I applaud you for your astute observation! Micronaut will substitute these values at runtime with the proper values based on the values that are stored securely in an OCI Vault. But I'm getting ahead of myself as we'll look at how that works in the next section. To complete my persistence tier, I needed to define my entities. Here's what the Game entity looks like - and I've simplified it somewhat for brevity by removing a few properties, but I have not changed anything necessary for persistence.
Let's talk briefly about a few noteworthy things in the above class. The class is annotated with @Entity to tell Micronaut it needs to manage this class. The other annotations are Lombok annotations that will handle generating the necessary getters and setters and necessary methods like equals() and hashCode(). The ID property is annotated @Id, and the match column stores the JSON response from the Call of Duty API. The createdOn property stores a timestamp. The entity is now defined, so the next step is to create a repository.
That's all the necessary code to get full CRUD at runtime in the application. I've defined additional methods in my repository for various queries and reports in my application, and we'll look at those later. But for basic CRUD, the job here is done. The repository is ready to be injected into services and controllers.
OCI Vault Secrets
As promised above, let's take a quick look at how I kept all of my credentials secure in my application. I've blogged on this topic before, so check out that post for further reference, but let's take a quick look at the feature in this post just as a refresher. I used the Micronaut Oracle Cloud integration module, which enabled me to store my credentials in a (free) OCI Vault and download a decrypted version of the credentials at runtime. The first step I had to perform was to create a vault and set the values of my credentials into individual secrets in that vault. Next, I had to make a new configuration file called bootstrap.yml in the /src/main/resources directory and set the vault and compartment OCID values into that config file.
The above configuration was for my local development environment. Note that the VAULT_OCID and VAULT_COMPARTMENT_OCID are the only values passed into the application at runtime. They certainly could have been hardcoded, but I felt better about externalizing all of the configuration values, so I chose to pass them in. Also, note that since I've got the OCI CLI configured locally, I am using my CLI config file to authenticate the SDK by passing in the path-to-config and setting use-instance-principal to false. But since my cloud VM can use instance principal authentication, I created a cloud-specific config file named bootstrap-oraclecloud.yml that is picked up in that environment. That config file looks like this:
That's all the necessary configuration for the application. Now, any secrets in the specified vault will be retrieved and injected into properties that exactly match the name of the vault secret. Easy, yet secure! What is better than that?
HTTPS Support via Micronaut ACME
ACME support is a feature that I don't believe I've ever covered in the past on my blog. I wanted to use TLS (HTTPS) for my web-based application, so I reached for the Micronaut ACME module. To generate a valid TLS cert, you must first create a keypair and create an account with an ACME provider. There are helpful CLI commands (mn create-key and mn create-acme-account) that we can use to generate the keys and account. Once you've created the keys and account, it's a matter of plugging the proper values into your Micronaut config (via application.yml). A valid TLS certificate will be generated (and automatically renewed when appropriate) for you.
Secured Endpoints
I wanted to keep specific endpoints and actions restricted to a logged-in user, so it was necessary to implement a login system. Once again, Micronaut has a module for that - Micronaut Security. Since the application was monolithic, I chose to use session-based security. Session-based security gave me the ability to annotate specific controllers and endpoints to restrict with @Secured and restrict or allow access with the necessary SecurityRule. I could also specify rules for static endpoints like scripts and images via my application.yml config file. Check out the module documentation or my code on GitHub for more info.
Consuming an MQTT Topic and Broadcasting Brain Data via WebSockets
As mentioned above, the Mind Flex published my brain data on an MQTT topic. To persist that brain data into Autonomous DB and broadcast the data to the front-end for live demo purposes, it was necessary to consume the MQTT topic. I accomplished this via a Micronaut module and core framework support. This time, I used the Micronaut MQTT module and the built-in WebSocket support.
Need an MQTT Server? Good news - I've blogged about launching your own (free) MQTT server in the cloud using either RabbitMQ or Mosquitto. Of course, there are other options, but those two are free and not difficult to get started with.
Since one of the central themes of this blog post is gaming, let's do a speed run for this section. First - dependencies (not shown, refer to docs) and config:
Next, a consumer annotated @MqttSubscriber. Notice the injection of a BrainRepository so that I can persist the reading, and a class called WebSocketBroadcaster which is available when WebSockets are enabled via a class annotated with @ServerWebSocket. The application used the WebSocket to broadcast the brain reading data to the front-end for live demos.
Done.
Collecting the Data
Now, I know what you're thinking. Indeed, this project required a very grueling, demanding, and time-consuming data collection effort. And - you're right. At least, that's what I told my wife as I the next month playing Call of Duty with the Mind Flex strapped to my head.
But seriously, I knew that I had to collect a lot of data to have a proper sample size to analyze the data correctly. So I spent about a month playing Call of Duty while wearing the device and uploading my brain activity to the cloud. Once I hit the 20-hour mark, I figured I had collected enough data to establish some patterns and prevent anomalies from tainting the results. I'm still not sure there's enough data to draw proper conclusions, but I noticed trends started to reveal themselves, so I wasn't sure that additional data would change the underlying results. So, what did the data show?
Analyzing the Data
To analyze the data, I needed to construct some SQL queries. To properly examine the data, I would need to "normalize" the JSON-based game data to perform aggregations on it. What do I mean by that? Well, consider my game table used to store individual game results from the Call of Duty API. A basic "select *" query on that table would look like so:
This query would produce a result that looked like this:
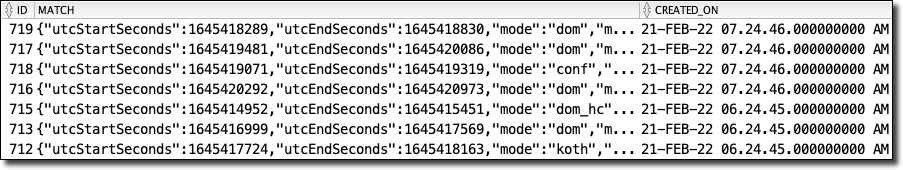
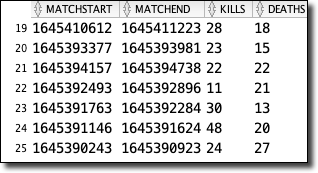
As you can see, the match column contains a JSON object. I like this. I'm OK with this. Since I don't have control over the third-party API, I want to remain flexible and not manually manage the schema every time the API changes. That would be a nightmare, and I don't like such headaches in my applications. So then, how can I query the individual values within the JSON object? By using "dot" notation, I can access the values. Consider the following:
Which gives me results that feel very familiar. I can go as "deep" as I need to (notice the embedded object playerStats inside the JSON object), and if I pass a key that doesn't exist in a given structure, I get a null value instead of an exception. That's one of the keys to remaining flexible with the data schema.
Since I would need to perform joins and many aggregations on this data ultimately, I settled on a materialized view that would make the game data "feel" like it was relational and would be updated any time the underlying game table changed. Here's how I did that:
The materialized view makes my aggregation queries much cleaner (instead of using "dot" notation for every element in the JSON object).
For other reports, I created an additional materialized view that joined the game data with the collected brain records where the brain record timestamp was between the game start and end time. If you're interested in that view definition, check it out here.
Faking Parameterized Views
While constructing additional views to analyze and report on the collected data, I found several views that shared a significant amount of SQL code but varied in how they grouped the resulting data. I quickly grew annoyed at updating each view every time I wanted to add or change a column, but I knew that Oracle DB does not support parameterized views, so I reached out to my boss and mentor, Gerald Venzl, with my issue. As with any matter of SQL, Gerald was quick to suggest a great workaround - SQL macros! Consider the following view definitions and note how they are nearly identical, except for the column used to group the data.
As always, when you simplify and reduce redundancies, your code becomes more manageable. In this instance, the answer was to create a SQL macro that allowed me to pass in the factor that I wanted to evaluate and query that column as needed.
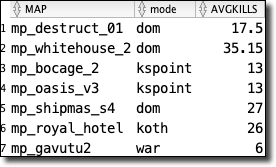
To call the macro, we treat it like a function that returns a result set:
Which produces the expected data.
Quite lovely, indeed!
Querying the SQL Views from Micronaut
Since I relied heavily on views and materialized views on the SQL side of things, adding the proper queries to my Micronaut repositories was relatively easy to do. For example, to get a list of game details for games that had associated brain records, I defined a method signature in my repository interface that would return a paged result of DTO projections and annotated the signature with @Query and passed in the native SQL to execute for this method.
And that's it. I can call the necessary repository method at runtime and get my results. The simplicity of Micronaut Data keeps my repository clean and easy to maintain.
Interpreting the Results
I spent approximately 21 hours playing around 150 online multiplayer matches and collected over 12k records of brain data. When I consider my original questions, I feel that I collected enough data to answer most of them. The first question I asked myself was: Can I read my brain data, and if so, is the data valid? And the answer is: YES! Well, to the extent that the Mind Flex provides accurate brain data. That's still somewhat debatable, but I did do some baseline experiments that seemed to indicate something to the data. The Mind Flex claims to read your actual brain waves - and it provides values for the individual bands (delta, theta, etc). But those values aren't provided in Hertz as they would be from a medical-grade EEG. Instead, they deliver what they call "ASIC_EEG_POWER_INT" values. Neurosky, the makers of the chip inside the Mind Flex, state these values would typically "typically be reported in units such as Volts-squared per Hz (V^2/Hz), but since our values have undergone a number of complicated transforms and rescale operations from the original voltage measurements, there is no longer a simple linear correlation to units of Volts." They go on to say that "they are only meaningful compared to each other and to themselves" and that "it would not necessarily be meaningful nor correct to directly compare them to, say, values output by another EEG system. In their currently output form, they are useful as an indication of whether each particular band is increasing or decreasing over time, and how strong each band is relative to the other bands". They also mention that "for display purposes, if you would like to remove the exponential gaps between the bands to make them appear closer to each other, you could display the logarithm of each value, instead of the exponential values themselves." And they're right - it does make the bands appear closer and improves the readability, so that's how I displayed the values in my reports.
In my opinion, the most useful part of the data provided by the Neurosky chip is the addition of "attention" and "meditation" values. These values are output on a scale of 1-100 and result from some internal calculations based on proprietary algorithms within the microcontroller on the module. Bottom line - it's not a medical-grade EEG but provides data that indicates your general level of attention and calmness. And that's fair enough in my book. It makes life easier when trying to gauge those specific factors. OK, back to my baseline experiments. So for these, I captured my brain data while performing various activities intended to establish the validity of the data and provide a baseline for comparison purposes later on. For example, I tracked my brain data during a somewhat boring work meeting in one experiment. I observed that my average "attention" level was in the mid 40% range, and my average "meditation" or "calmness" level was in the mid 50% range. That's certainly a much higher quantification than e expected based on how much I feel like I'm paying attention during work meetings!
Conversely, I captured my brain data during several actual meditation sessions. I observed a significant decrease in my "attention" levels - low 30% numbers - and a noticeable increase in my "meditation" values - above 70% at times! I also performed a capture while playing various online "memory" type games and observed attention levels in the mid 60% range. Again, there certainly appears to be something to this data. It doesn't seem to be "pseudo-random gibberish."
So, more questions. Can I improve my performance in video games by being super focused and concentrating? If I'm distracted, will I play poorly? Will a "bad game" be visible in my brain activity? These questions are harder to answer. It's difficult to say whether or not I can directly influence my performance by really concentrating. Honestly, maybe I didn't quite think through the questions. It's tough to force yourself to focus while playing a video game. The very act of "trying" to focus, at least for me, is distracting in and of itself. So I can't say if it's possible to improve my performance by concentrating, but I can look at the collected data and see if any patterns appear to support my theory. Before we look at that, let's discuss what factors I decided would indicate "good" performance. Your first thought might be that "wins and losses" would be an excellent factor to judge my performance, but since most of the game modes in Call of Duty (at least the ones that I tend to play the most) are team-based, I don't think that wins and losses are the proper metric to determine my success or failure. Also, my win/loss ratio is pretty garbage. Because I mostly play with random teams instead of with a party, I tend to lose a lot. So instead of wins and losses, I decided to look at other factors like my personal kill/death and elimination/death (commonly known as "K/D" and "E/D" ) ratio. I also considered scores and kills per minute and accuracy (how often I hit the intended target). What does the data show? Let's look at some results from a few reports I wrote to combine and analyze the data. As I mentioned earlier, I pulled my Call of Duty stats via some...undocumented...API calls to the Activision API. Once I had the game stats, I joined them to my captured brain activity based on the brain and match start/end timestamps.
Game Performance Grouped by Attention
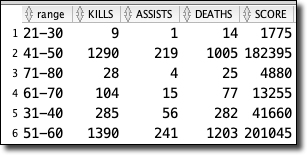
First up - Attention. I grouped my stats based on average attention range - 0-10%, 11-20%, etc. Out of the 20+ hours I tracked, this is the amount of time spent in the various ranges.
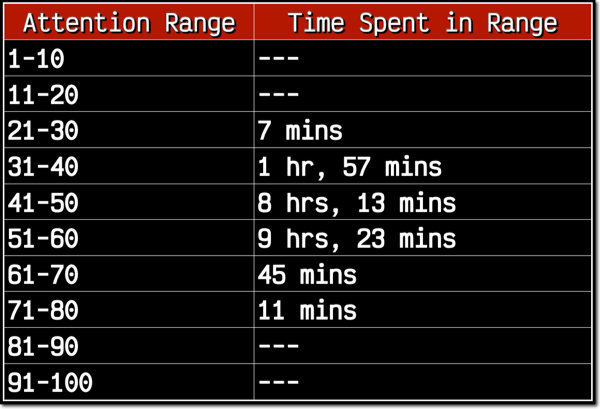
As you can see, I spent no time playing in the 1-20% or 81-100% range, and well over 95% of my time playing in the 31-60% range. Let's throw out the 21-30 and 71-80 ranges since I spent such little time in them. The 61-70 range might even be a little too small of sample size, so it would be with a rather large grain of salt if I did consider it. My hypothesis stated that the more focused I was, the better I would perform. However, if it's believed, the data tells a different story.
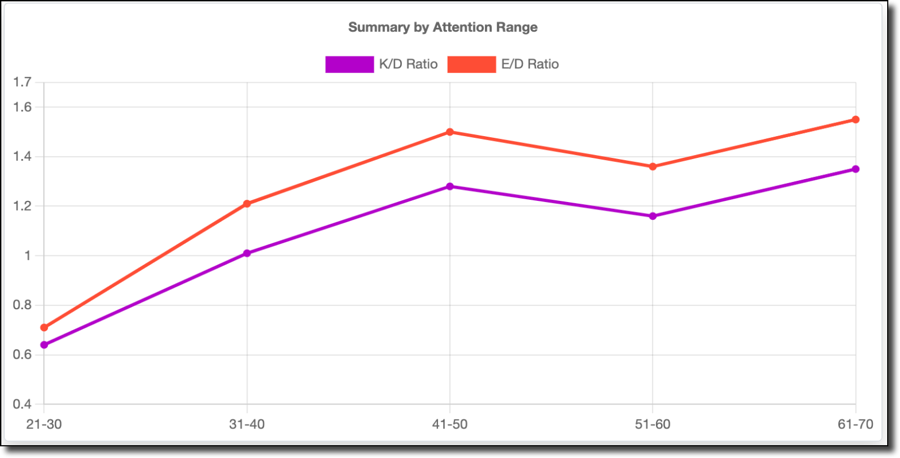
My K/D and E/D results start low when my attention is low, and increase until they peak at the 41-50% range. They drop in the 51-60% range and grow again in the 61-70% range, but as I said about that range - it's a minimal sample size of 45 minutes, so that could be considered an anomaly, and as I said - grain of salt. This is interesting to me because I hypothesized that there would be a corresponding increase in performance and attention, so this data seems to disprove my hypothesis. In hindsight, this actually makes sense! First-person shooters require attention and focus, but paying too much attention can be detrimental. Ask any gamer about what's going on in their brain when they have a perfect match, and they'll tell you that they are "locked-in" mentally, but not hyper visually focused. Instead, they tend to almost "zone out" and let their eyes/ears/brain observe the entire picture. Instead of visually scanning the screen looking for enemies, you tend to do best when you place visual focus on your crosshairs and listen for footsteps. You have to almost intentionally not focus on every little detail happening on the screen and let your brain react to the minor changes in the environment that might indicate the presence of an enemy and redirect your crosshairs in reaction to the visual or auditory stimuli. If you explicitly try to aim and shoot, you often miss the target. You tend to play best when you're reactive instead of proactive.
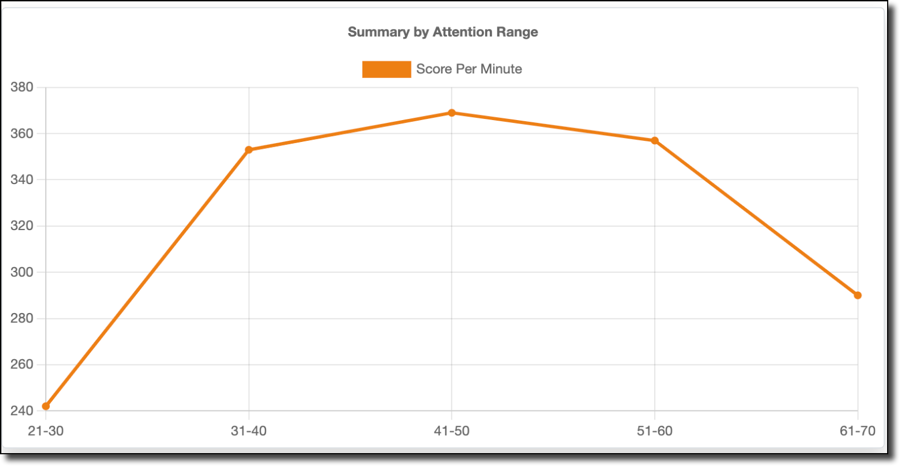
Score per minute data (shown above) shows a similar trend, with a low score per minute for low attention ranges, rising to a peak at 41-50% and falling with increased attention. As does kills per minute:
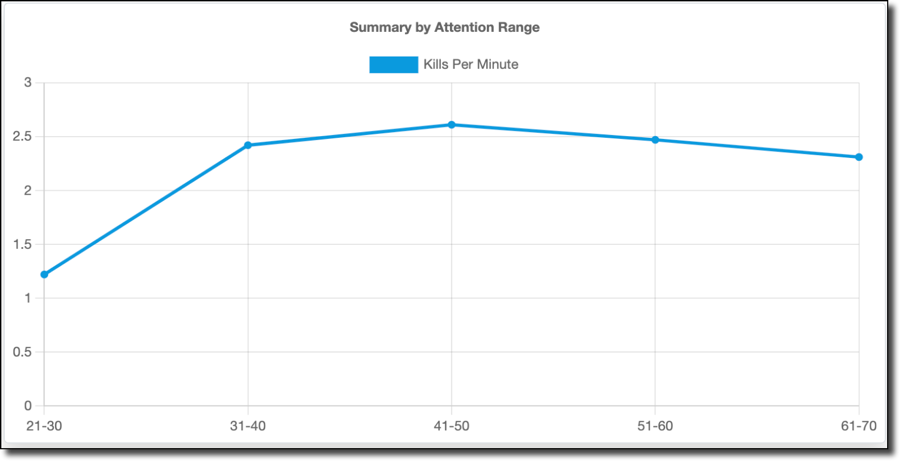
Accuracy (shown below) is an odd "W" shaped graph, but the 31-60% range I spent 99% of my time playing follows the same trend.
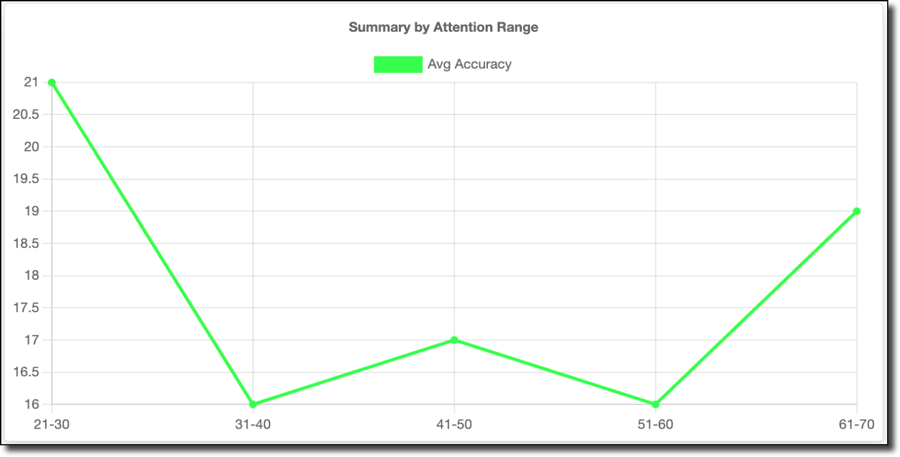
So, my best gaming happens when my attention is in the 41-50% range. If I pay more attention, I actually do worse—fascinating stuff.
Game Performance Grouped by Meditation
Let's move on to meditation. I didn't state anything in my hypothesis directly related to calmness, though I hypothesized that distractions would lead to poor performance. Is there a relationship between calmness and distraction? When you're distracted, are you not calm? Perhaps, but maybe that's a stretch. Either way, the calmness data is pretty fascinating. I broke out meditation into the same range of groupings.
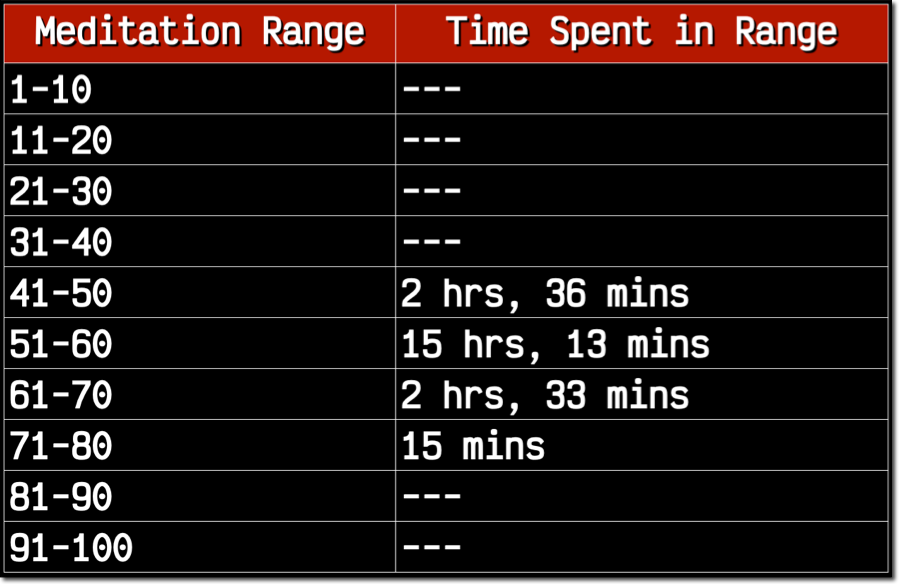
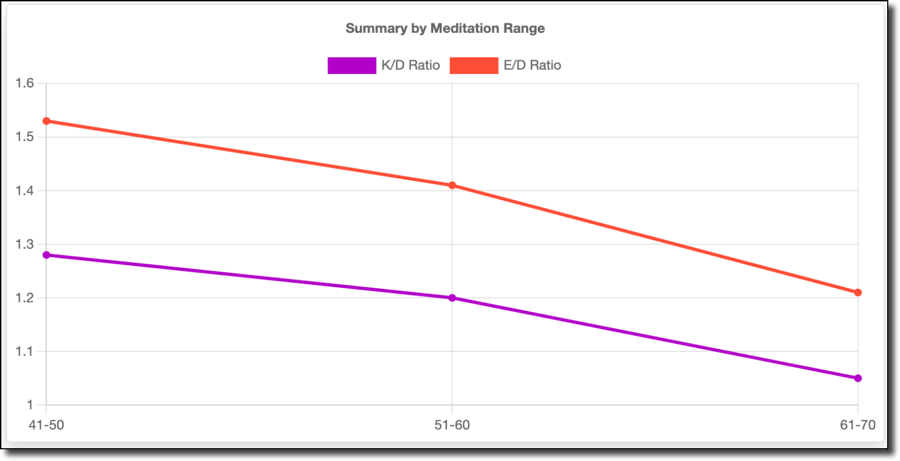
As shown above, I spent all of my time playing in the 41-80% range. 15 minutes in the 71-80% range represents less than a half percent of the time, so I threw that out. Interestingly, the data below clearly shows a decline in performance when my meditation value, or calmness, increases. I do better when I'm not calm. This was unexpected, but it makes sense when I think about it! Indeed being calm or relaxed would indicate a decrease in reaction time, and slower reflexes mean I die faster and more often.
My average score follows this trend:
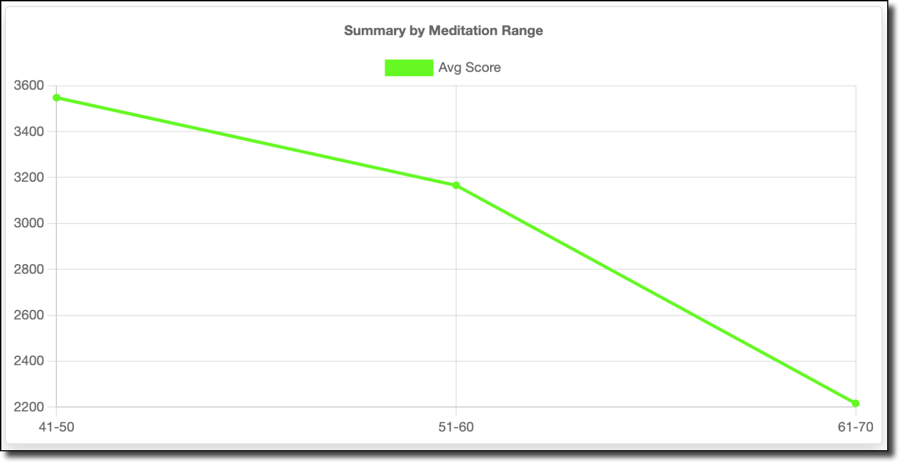
As does my score per minute:
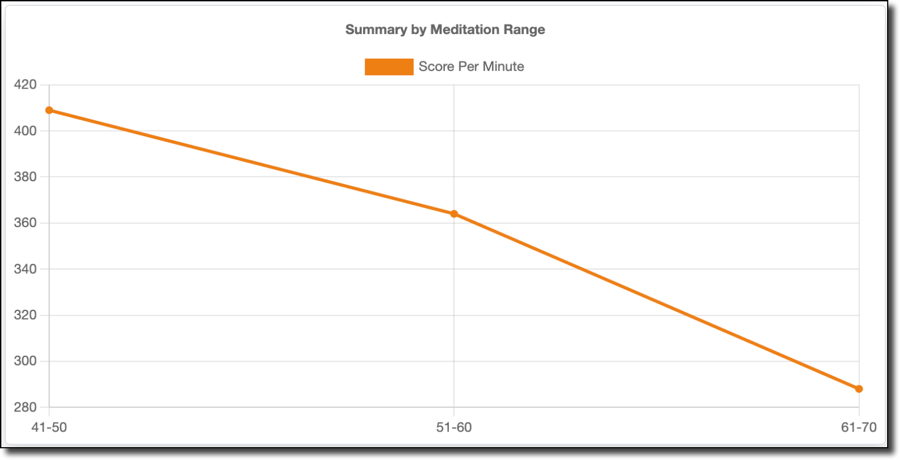
As well as kills per minute:
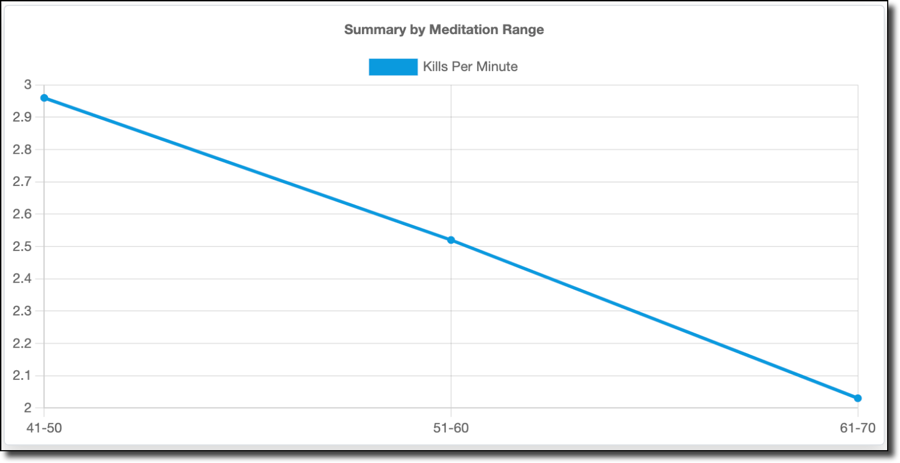
The calmness, or meditation values, seem to reflect reality. Certainly, poor gameplay is not increasing my calmness - there's no way a bad game would make me calmer. So I'm going to have to assume that my poor performance is a result of me being too relaxed (or tired). It might be interesting to compare the meditation values to time of day, to see if there is a pattern of increased meditation values and decreased game performance late at night when I'm tired and should be in bed instead of gaming.
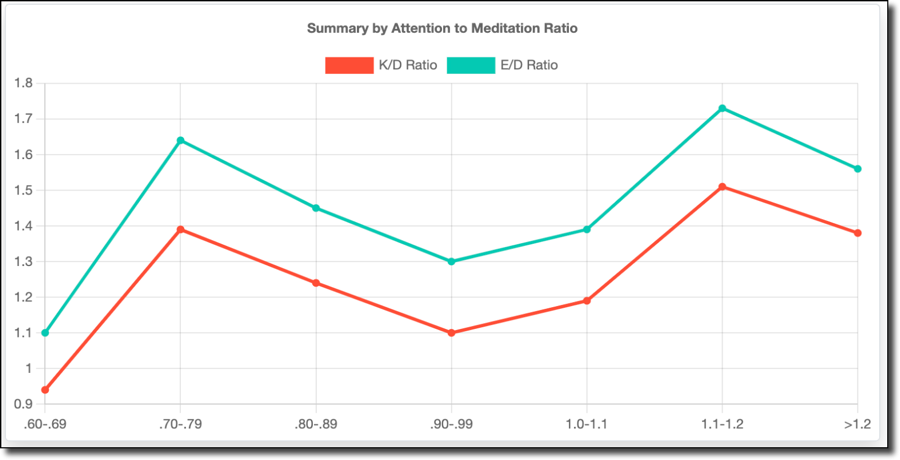
Game Performance Grouped by Attention to Meditation Ratio
In addition to looking at the impact of attention and meditation on performance, I took another approach and grouped my stats by the ratio of attention to meditation. These were grouped as follows:
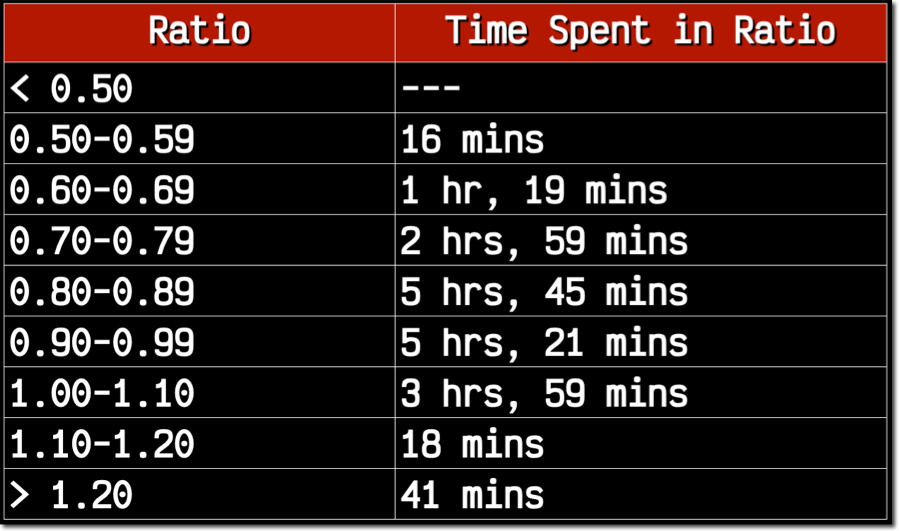
99+% of the stats fell into the .60-1.1 attention to meditation range, so we'll throw out the rest. My K/D and E/D were best when my average attention (45%) was roughly 70-79% of my meditation (almost 60%) value.
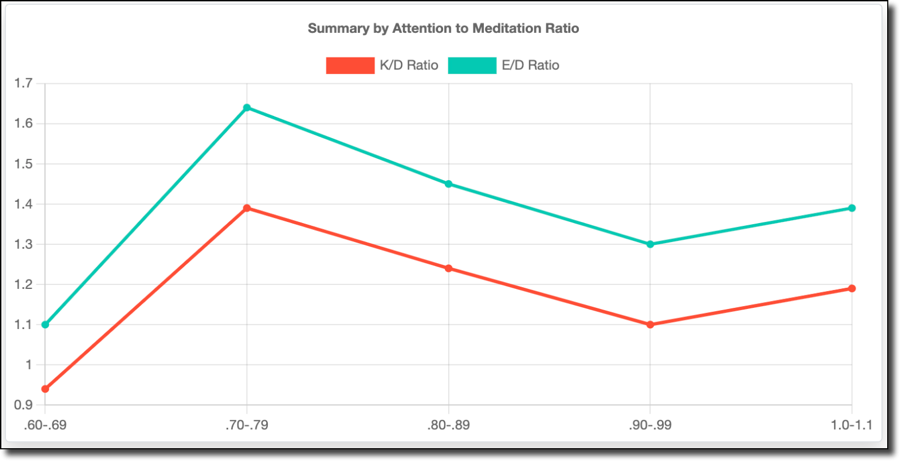
I'd like to include the other ranges (shown below) because things get interesting when my attention level is higher than my meditation level. Still, I don't think there is enough data to consider this valid.
Interestingly, my score per minute (below) does not follow the K/D trend, but trends upwards as my attention level approaches the same or higher level as my meditation.
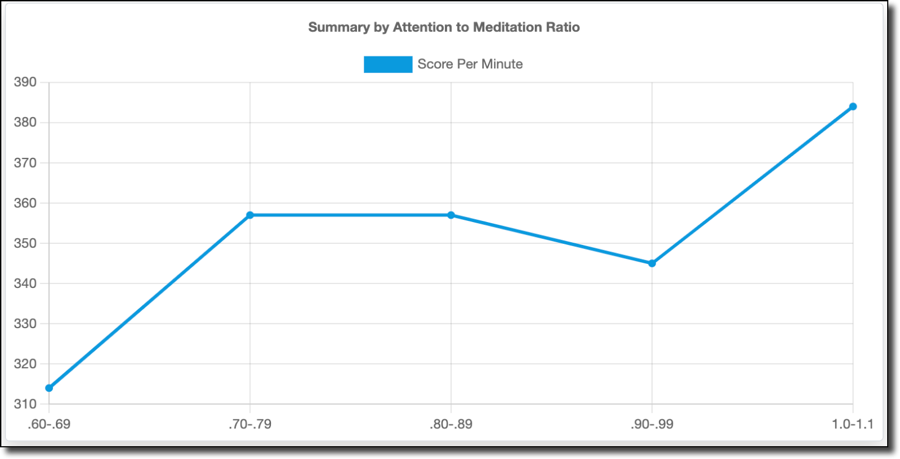
The kills per minute graph (below) mirrors the score per minute graph. You might think that kills equate to score, but score includes other factors like objective captures, assists, non-lethal equipment usage (stun grenades, smoke grenades), and killstreaks. So it's not as direct a relationship as you might think.
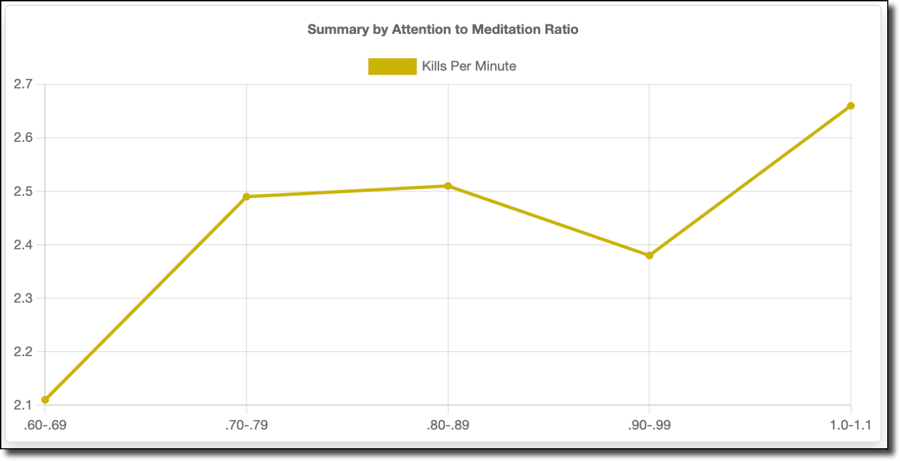
I'm not sure how to interpret the data related to the attention to meditation ratio or if that's even a valid approach to looking at it at all. But, I did include it here as an alternative, because I wanted to take an alternative approach to look at things.
Distractions
So what about distractions? I had hoped to test and visualize the impact of being distracted, but it ended up being somewhat impossible to test. I'm guessing that it's just not something that would be easy to visualize on an EEG, since when I played a match with a staged distraction like watching a YouTube video during the match my attention levels really didn't change all that much. Perhaps because I was still technically paying attention, just to something other than the video game? Sadly, this wasn't something that I could really consider based on the hardware, so I can't really say whether a distraction made me play worse and back that up with quantifiable data.
Results and Summary
So, is there a direct, measurable relationship between superior gaming performance and high levels of attention? Or, are there just too many factors at play? It's hard to say definitively, but there certainly seems to be trends that indicate my performance relates to my brain activity. My game performance is best when my attention and meditation values are moderate. When I pay too much attention or am too calm, my performance decreases. I've spent a lot of time on this project - from the idea phase to the hardware and software builds to the data collection - it's been a passion that has spanned several months. I'm not a neuroscientist, but I've learned a bit about focus, attention, and calmness and how they relate to my video game performance. I've gotten to spend time on things that I'm highly passionate about - hardware tinkering, writing software, and analyzing data in the cloud. Overall, I'd say the project was a huge success. To learn more about this project, check out the links below. If you have any insight that you'd like to share or have an opinion about a different approach or ways to look at the data, leave a comment below.
Links
If you'd like to check out the code behind this project, or read about the inspiration, see the following GitHub repos and links:
- https://github.com/recursivecodes/brain-to-the-cloud-arduino
- https://github.com/recursivecodes/brain-to-the-cloud
- https://github.com/kitschpatrol/Brain
- https://github.com/plapointe6/EspMQTTClient
- http://www.frontiernerds.com/brain-hack
Spread the Word! If you find this project interesting, it would be extremely helpful if you could give a "like" on YouTube, or share the site with your friends on your favorite social network. So please, click one of the share buttons below!